A deep dive into the Eurostoxx50
INTRODUCTION
Like a sports club, the performance of the team is linked to the performance of its members. And team members change over time. They mature, they are transferred, and they can change their playstyle as well.
The Eurostoxx 50 index in 2021 is very different from what it was ten years ago. It has changed with the incorporation of new companies, especially of the new economy. We show in this article some facets of this evolution. While the European index remains one of the most traded in the world, this element should be kept in mind since it partly undermines historical comparisons, especially those that deal with valuation aspects.
THE INDEX TODAY
The Eurostoxx50 is the benchmark index for the European equity market. It is an index made of the 50 largest stocks in the euro zone, weighted by their free float-adjusted market capitalization. A security cannot exceed 10% of the index. The index is reviewed annually although there is a fast-exit procedure in the event of exceptional events (mainly mergers / acquisitions).
The index was launched in February 1998 but with a base of 1000 as of December 31, 1991 because it was retropolated until December 31, 1986.
It is the second most traded underlying in the world among the index futures markets (more than € 200bn in open interest currently), behind the S&P500 (€ 477bn in open interest) but well ahead of the Nikkei, the Nasdaq 100 or the MSCI Emerging Markets. This index is more traded than the DAX, the CAC, the IBEX and the FTSMIB combined since the sum of the open interests on these country indices represents only one third of the open interests on the Eurostoxx50.
Knowing the constituents of the Eurostoxx50 is a compulsory exercise for anyone wishing to understand the nature of the risk of this benchmark. We show below the profound evolution of the components of the Eurostoxx50 by comparing its current sector allocation with that it had in 2007.
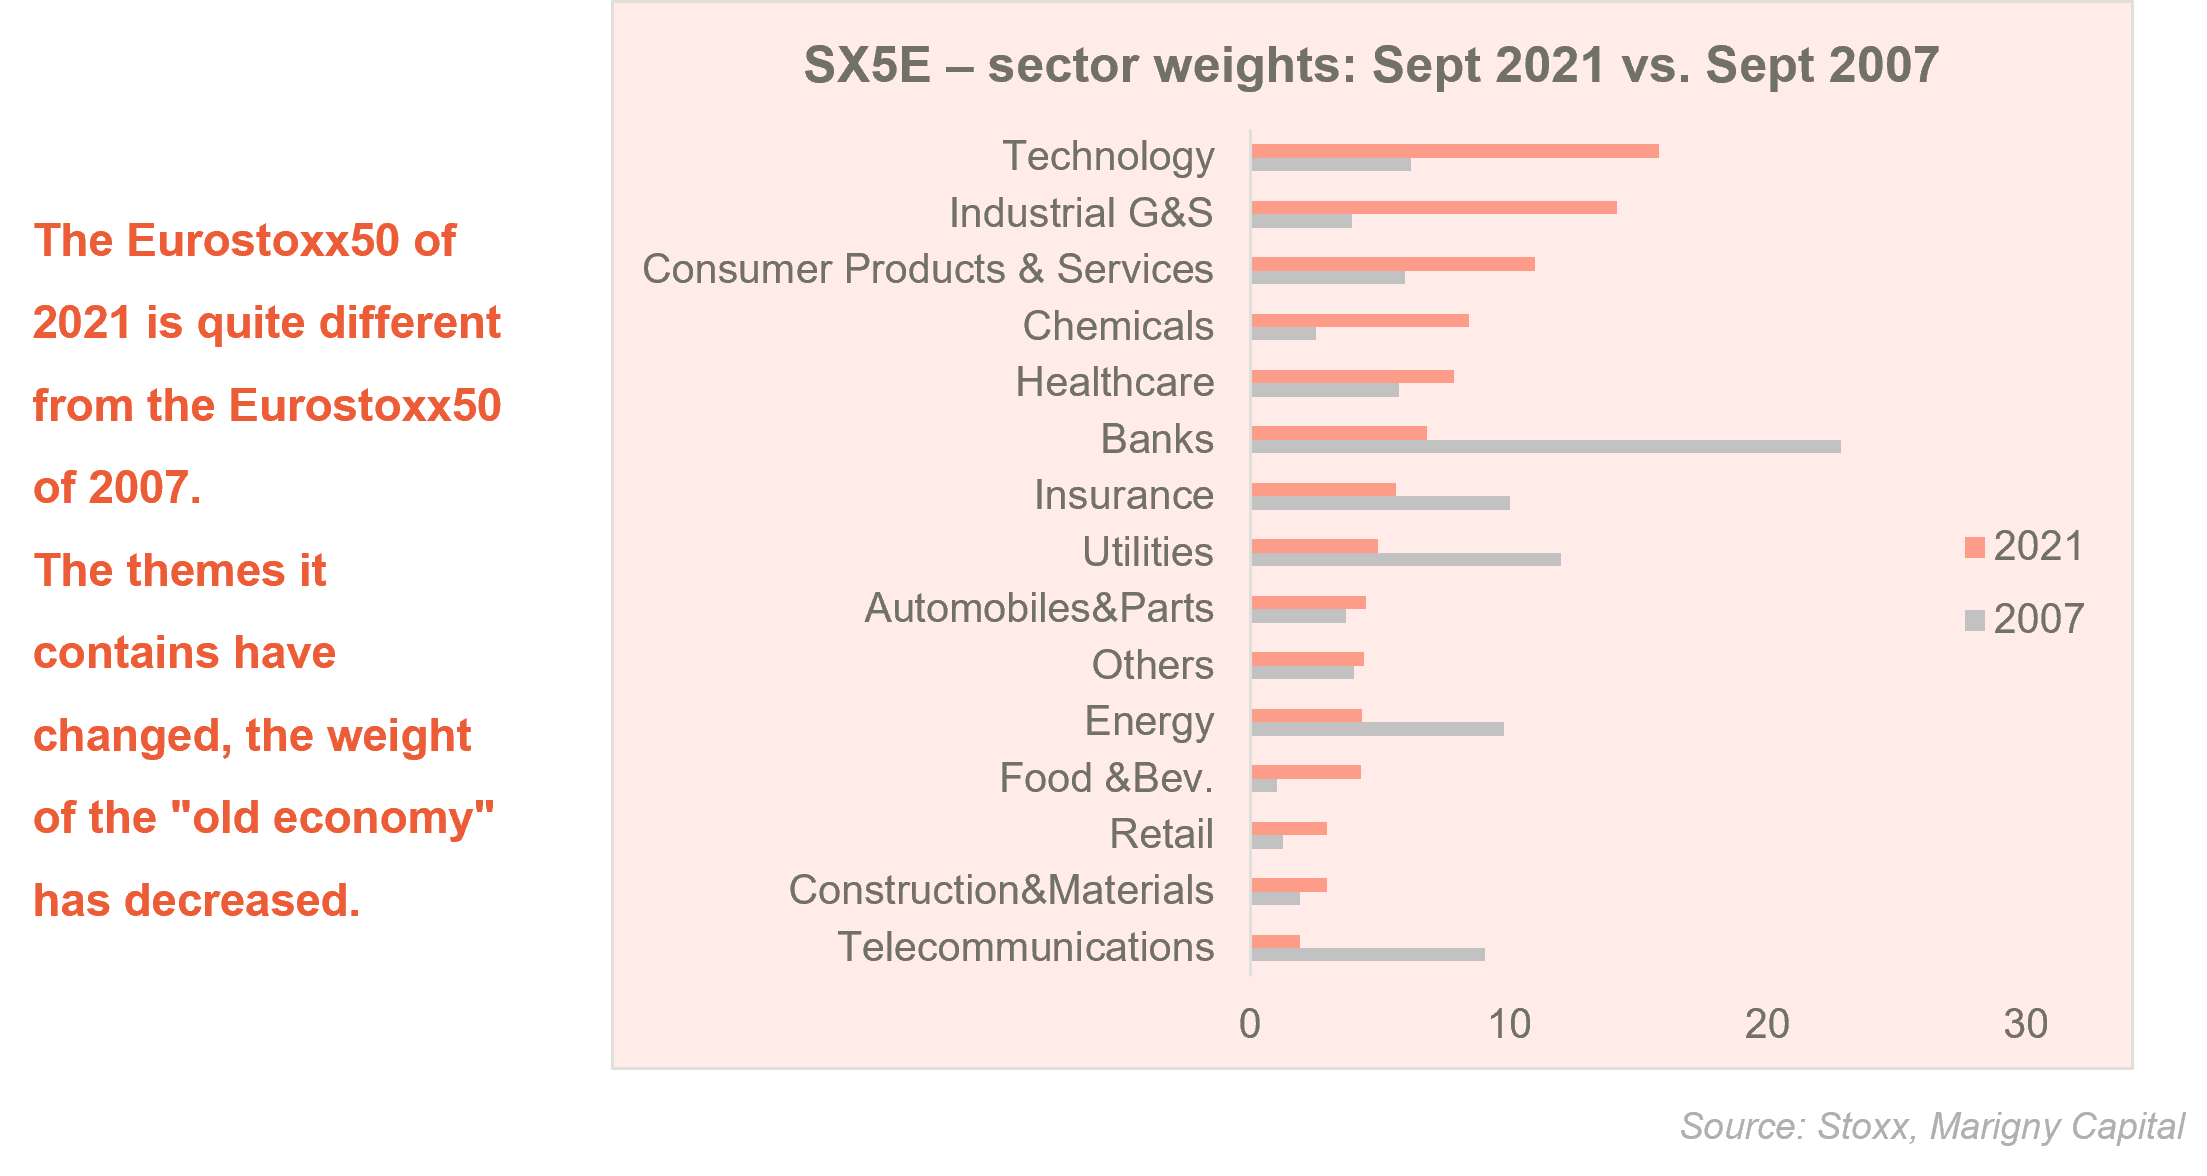
The result is impressive and it is a nice reminder that the 2007 Eurostoxx50 has nothing to do with today’s Eurostoxx 50. Sectors that have gained weight are technology, industry, consumer goods and services, and chemicals. The sectors which have seen their weight decrease are banking, utilities, oil companies, telecoms and finally, insurers.
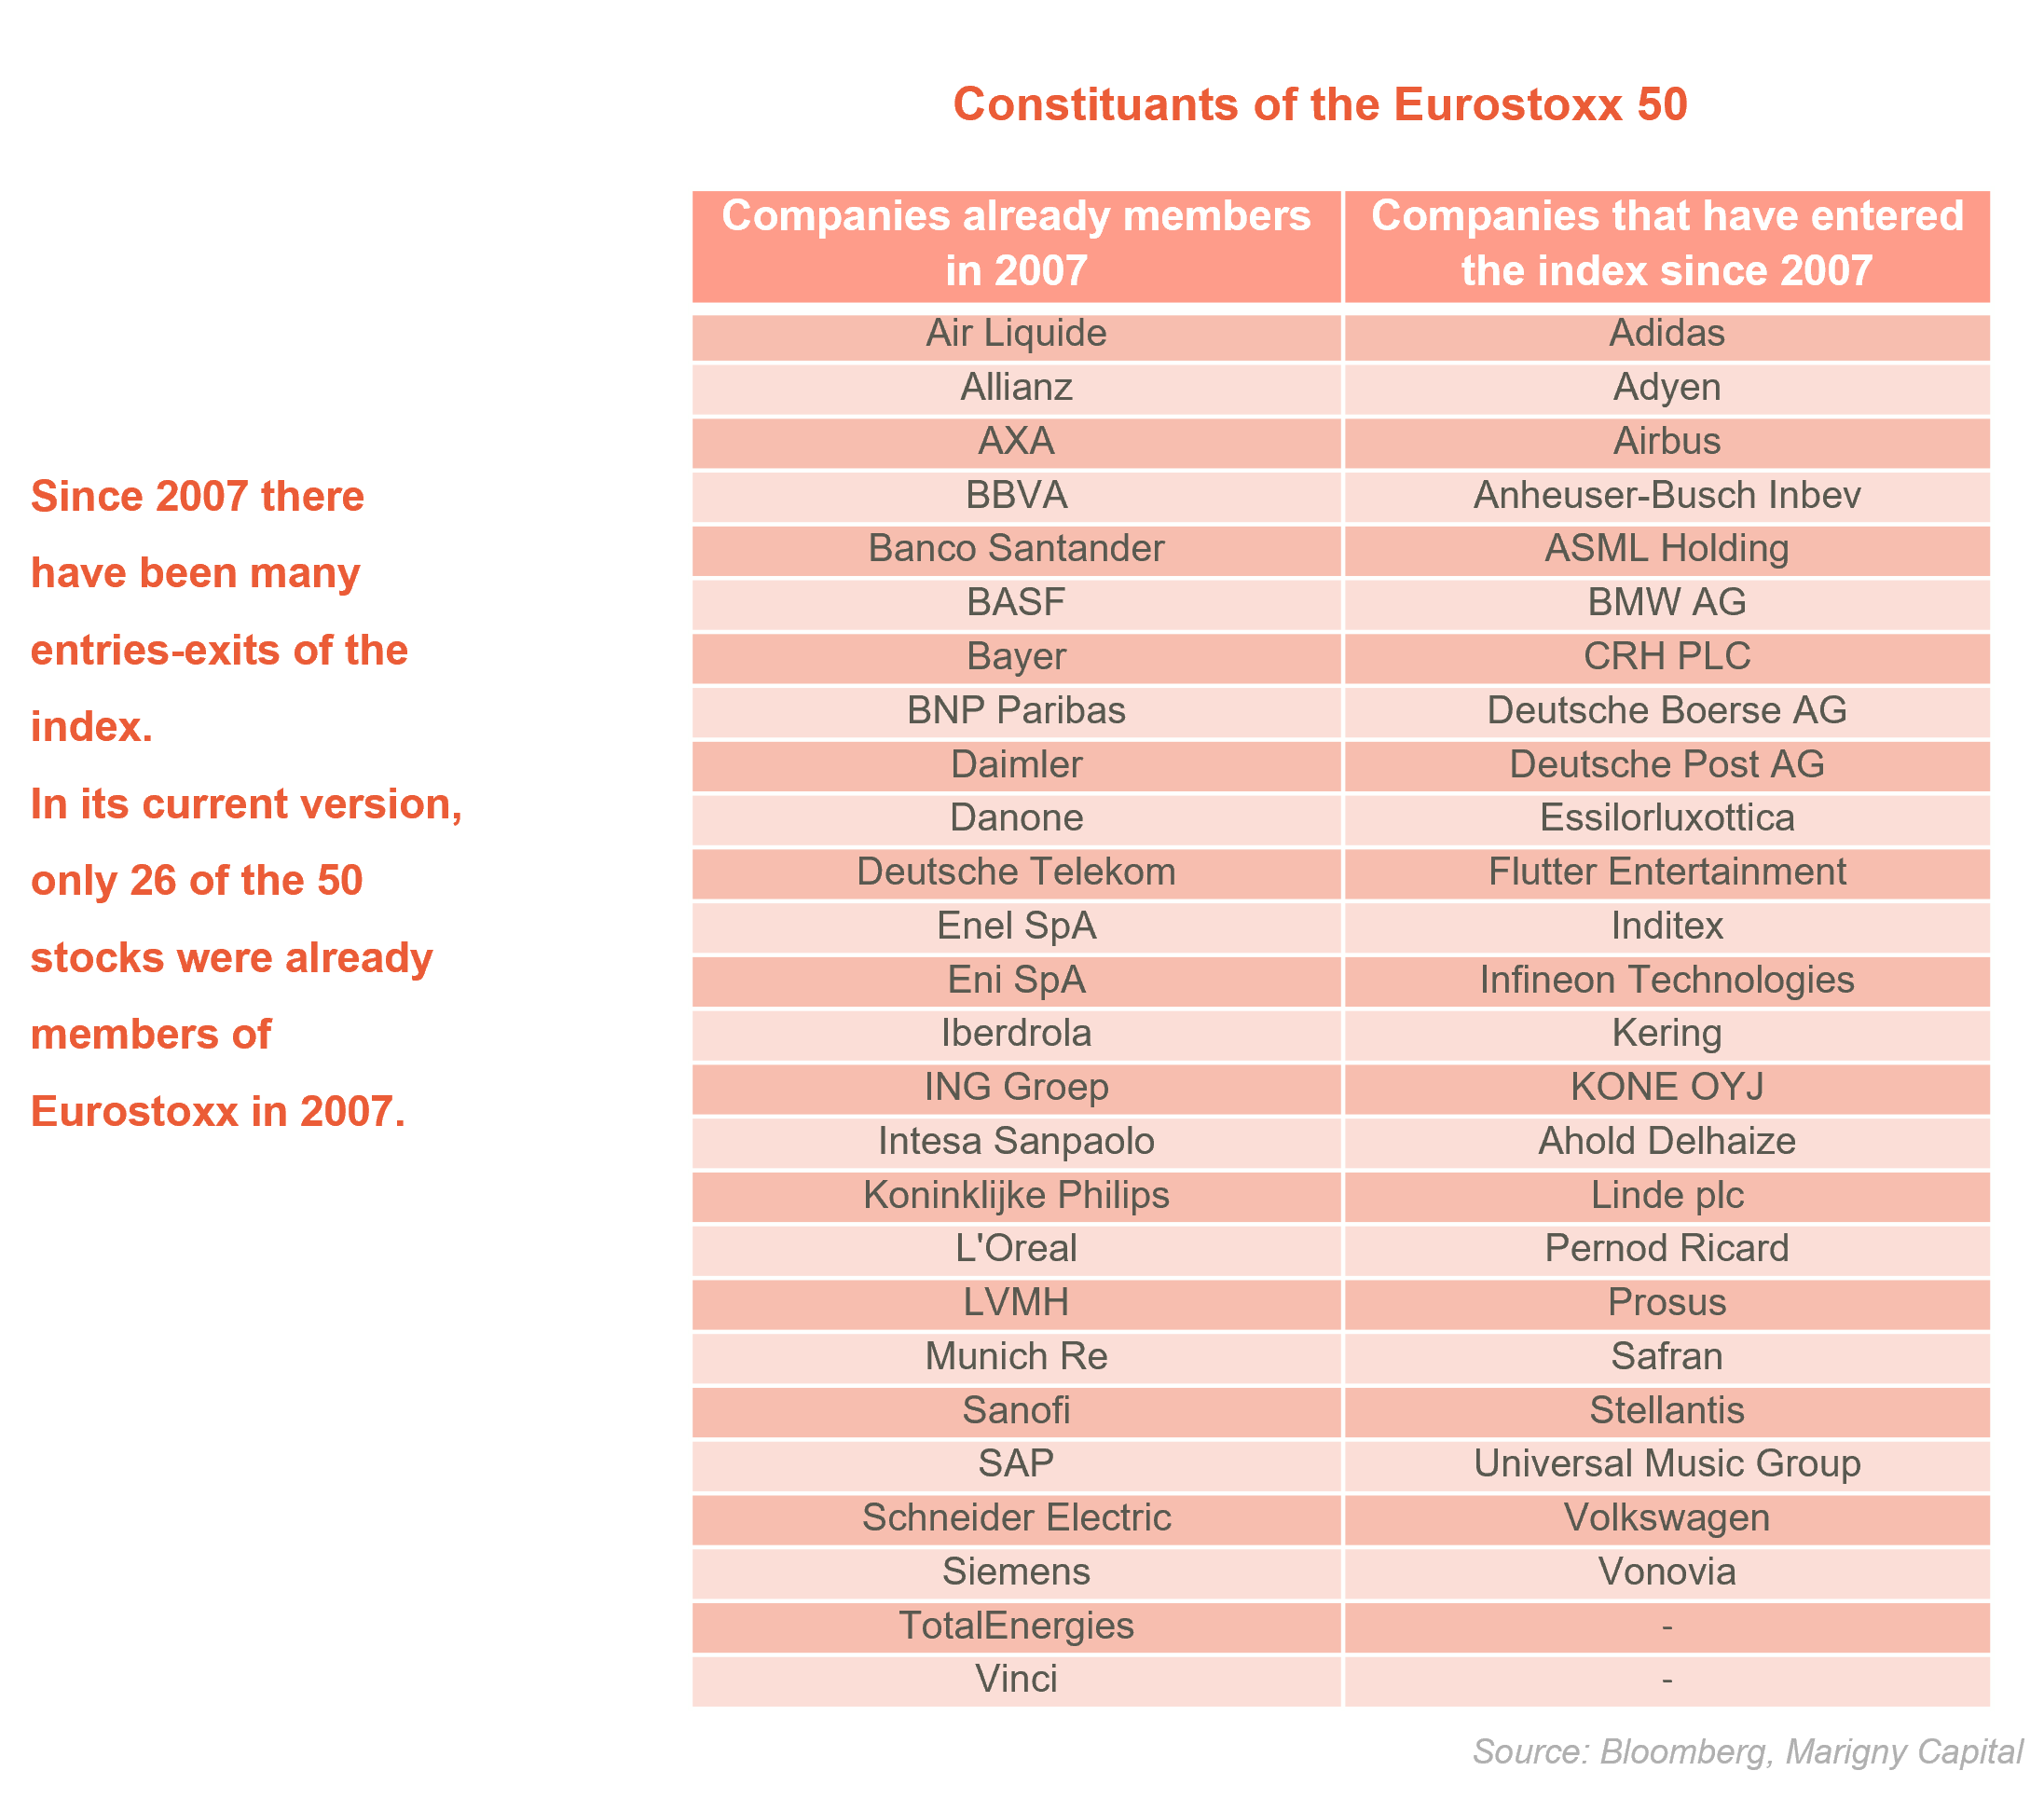
In terms of companies, we see that out of the current 50, only 26 were already present in the index in 2007. We list them in the following table :
COMPARISON WITH THE INDEX OF YESTERDAY
We looked at the top 10 largest companies. A company can be large by its market capitalization, but also by its turnover, its number of employees or more simply its profits. In theory profits are supposed to be the primary determinants of the valuation of a company. We compared the 10 largest companies by capitalization, profits, today and in 2007.
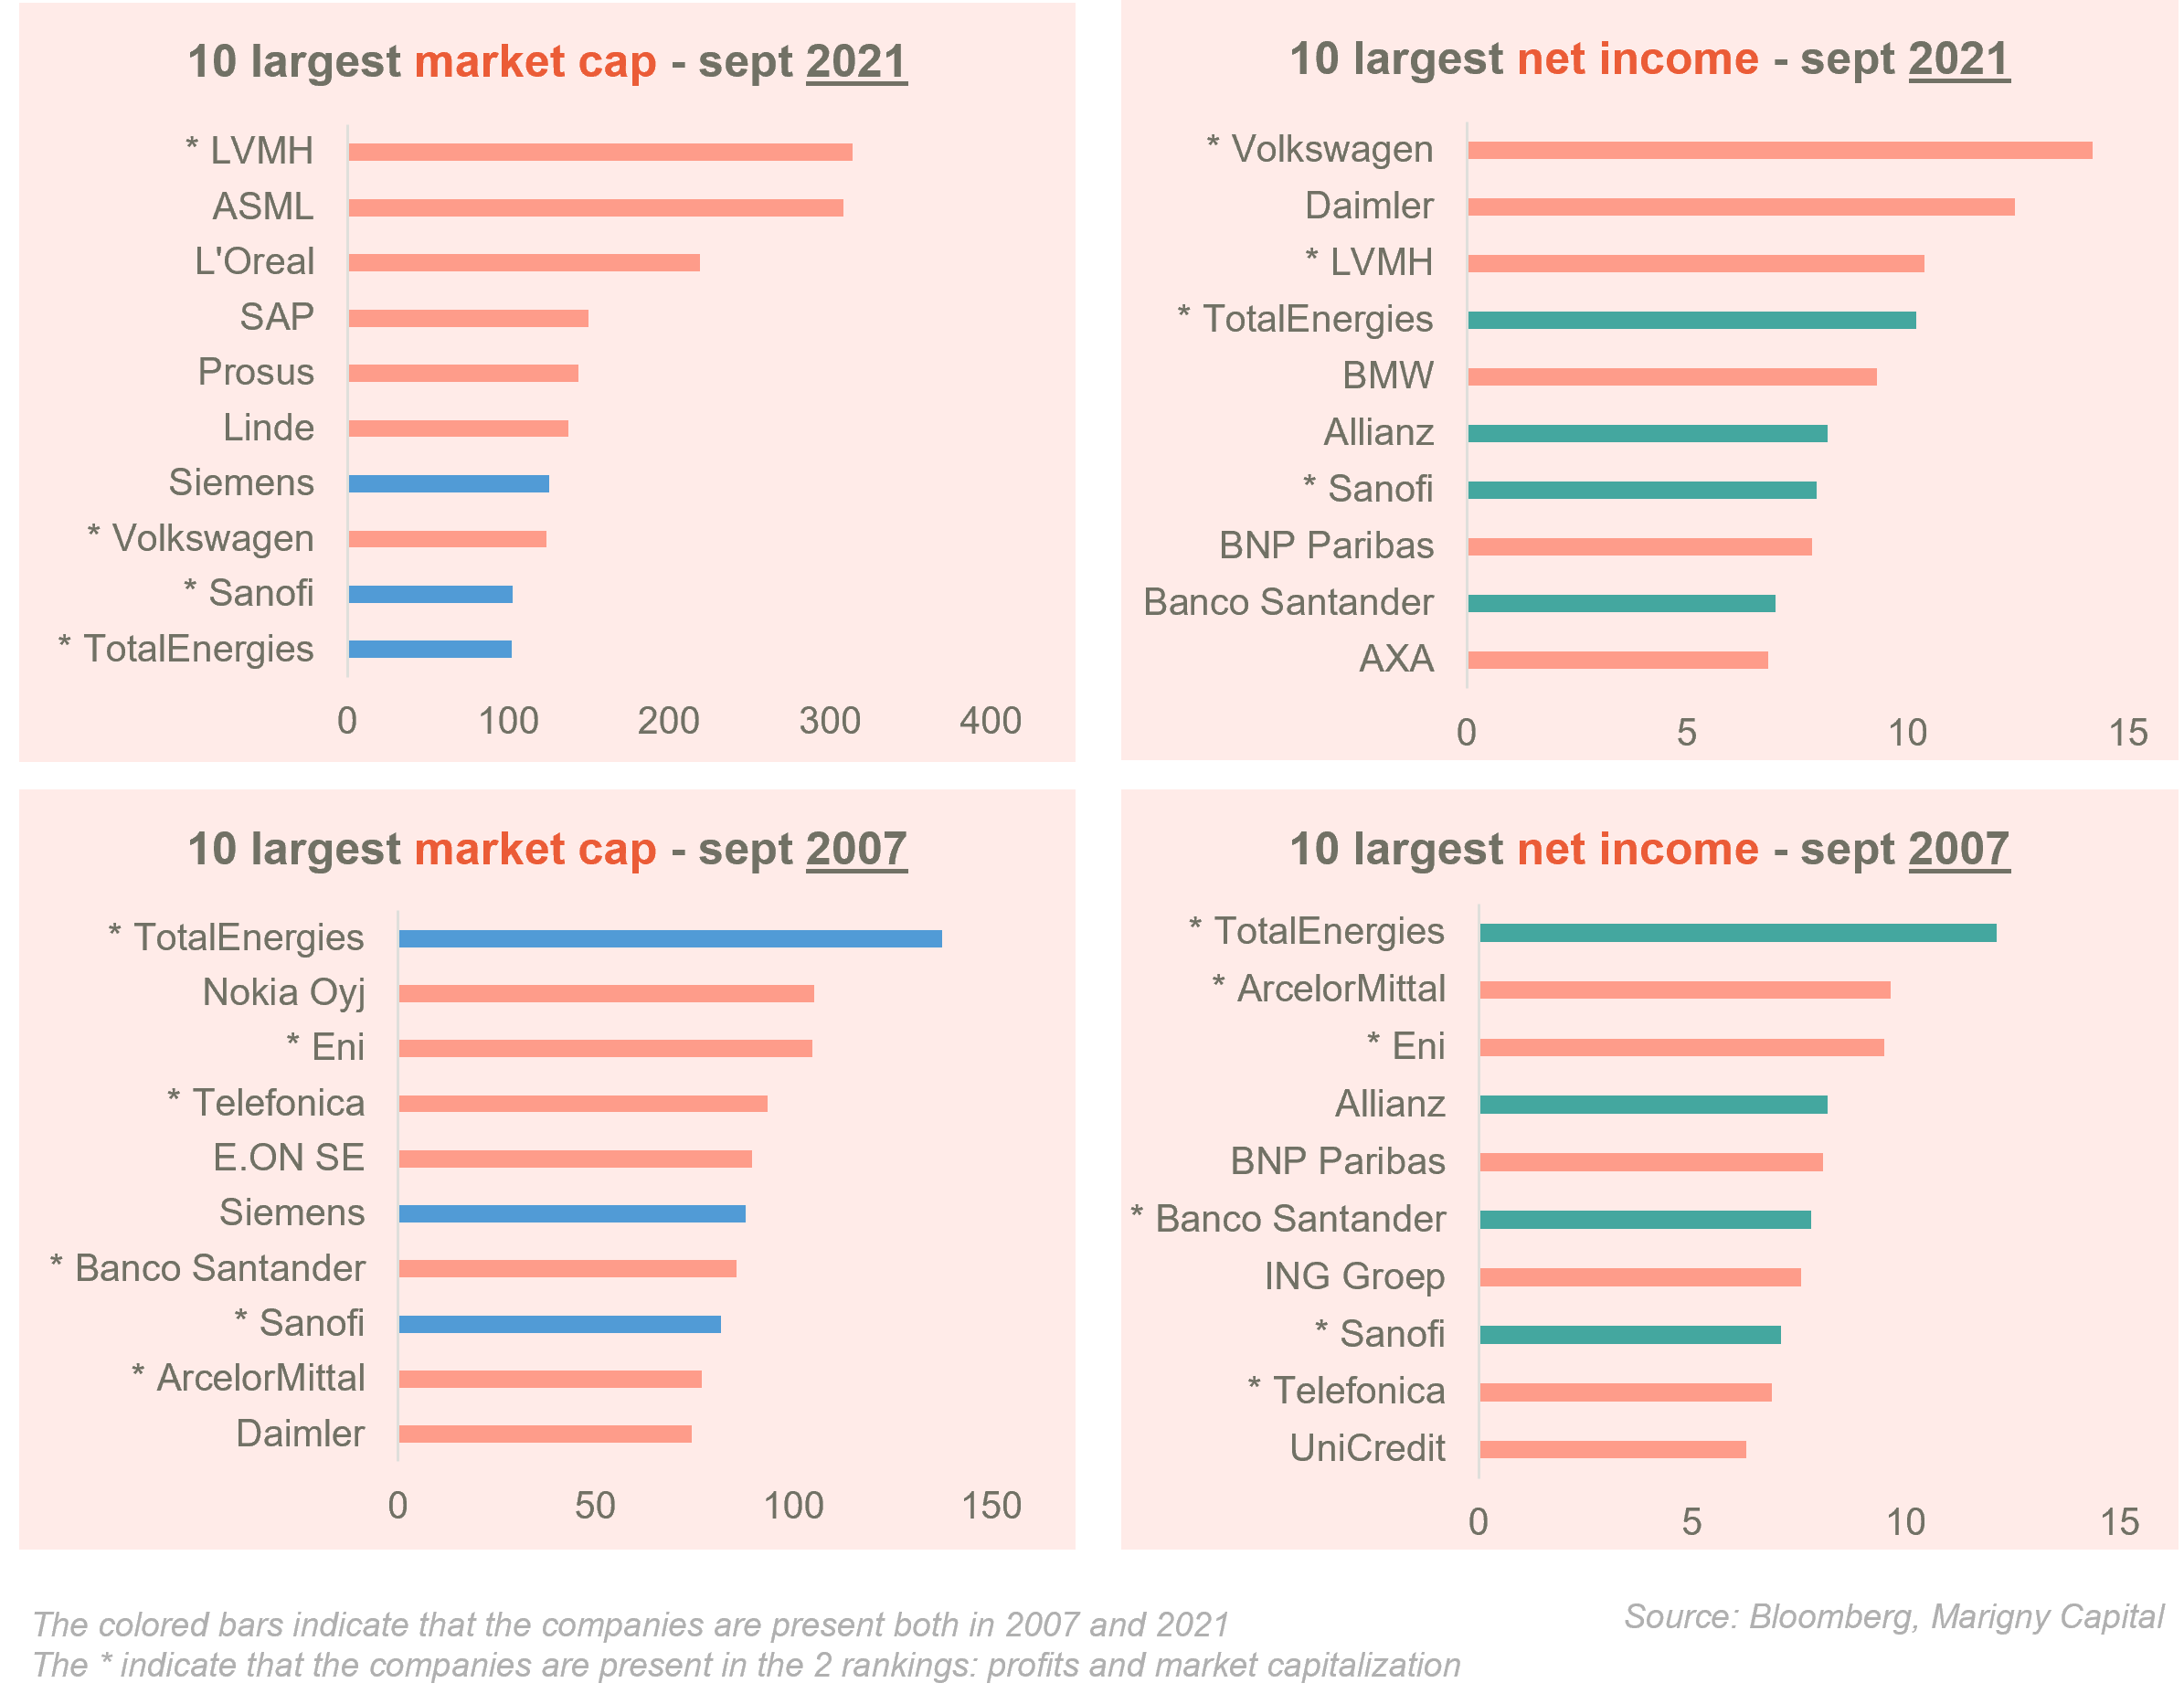
Today’s leaders are not yesterday’s leaders. This is very true if we look at valuation since only three stocks remain in the top 10 (TotalEnergies, Siemens and Sanofi) but it is less true if we look at profits.
If we come back to this value / growth classification that everyone is talking about, we could say that growth stocks are now important within the index. However, this observation is valid for the criterion of capitalization but for the criterion of profits, it is the banking, insurance and automobile sectors – therefore the old economy – which is still very widely represented, as in 2007.
Is this divergence between stock market leaders and profit leaders sustainable? This is not the subject of this discussion, but we must be aware of it because when we buy a capitalization-weighted index, we buy securities with a certain level of valuation.
THE EUROSTOXX50 AND ITS ECONOMIC REPRESENTATIVITY
The spontaneous question concerns the economic representativeness of the index. Indeed, the stock market index of a country could only be a simple reflection of its economy and since the real economy changes over time, it would be consistent for the stock indices to change as well.
We show on the following page the change through time of the weight of certain sectors in the Eurostoxx index and the recent changes are sufficiently important to answer yes and no to the question we are asking.
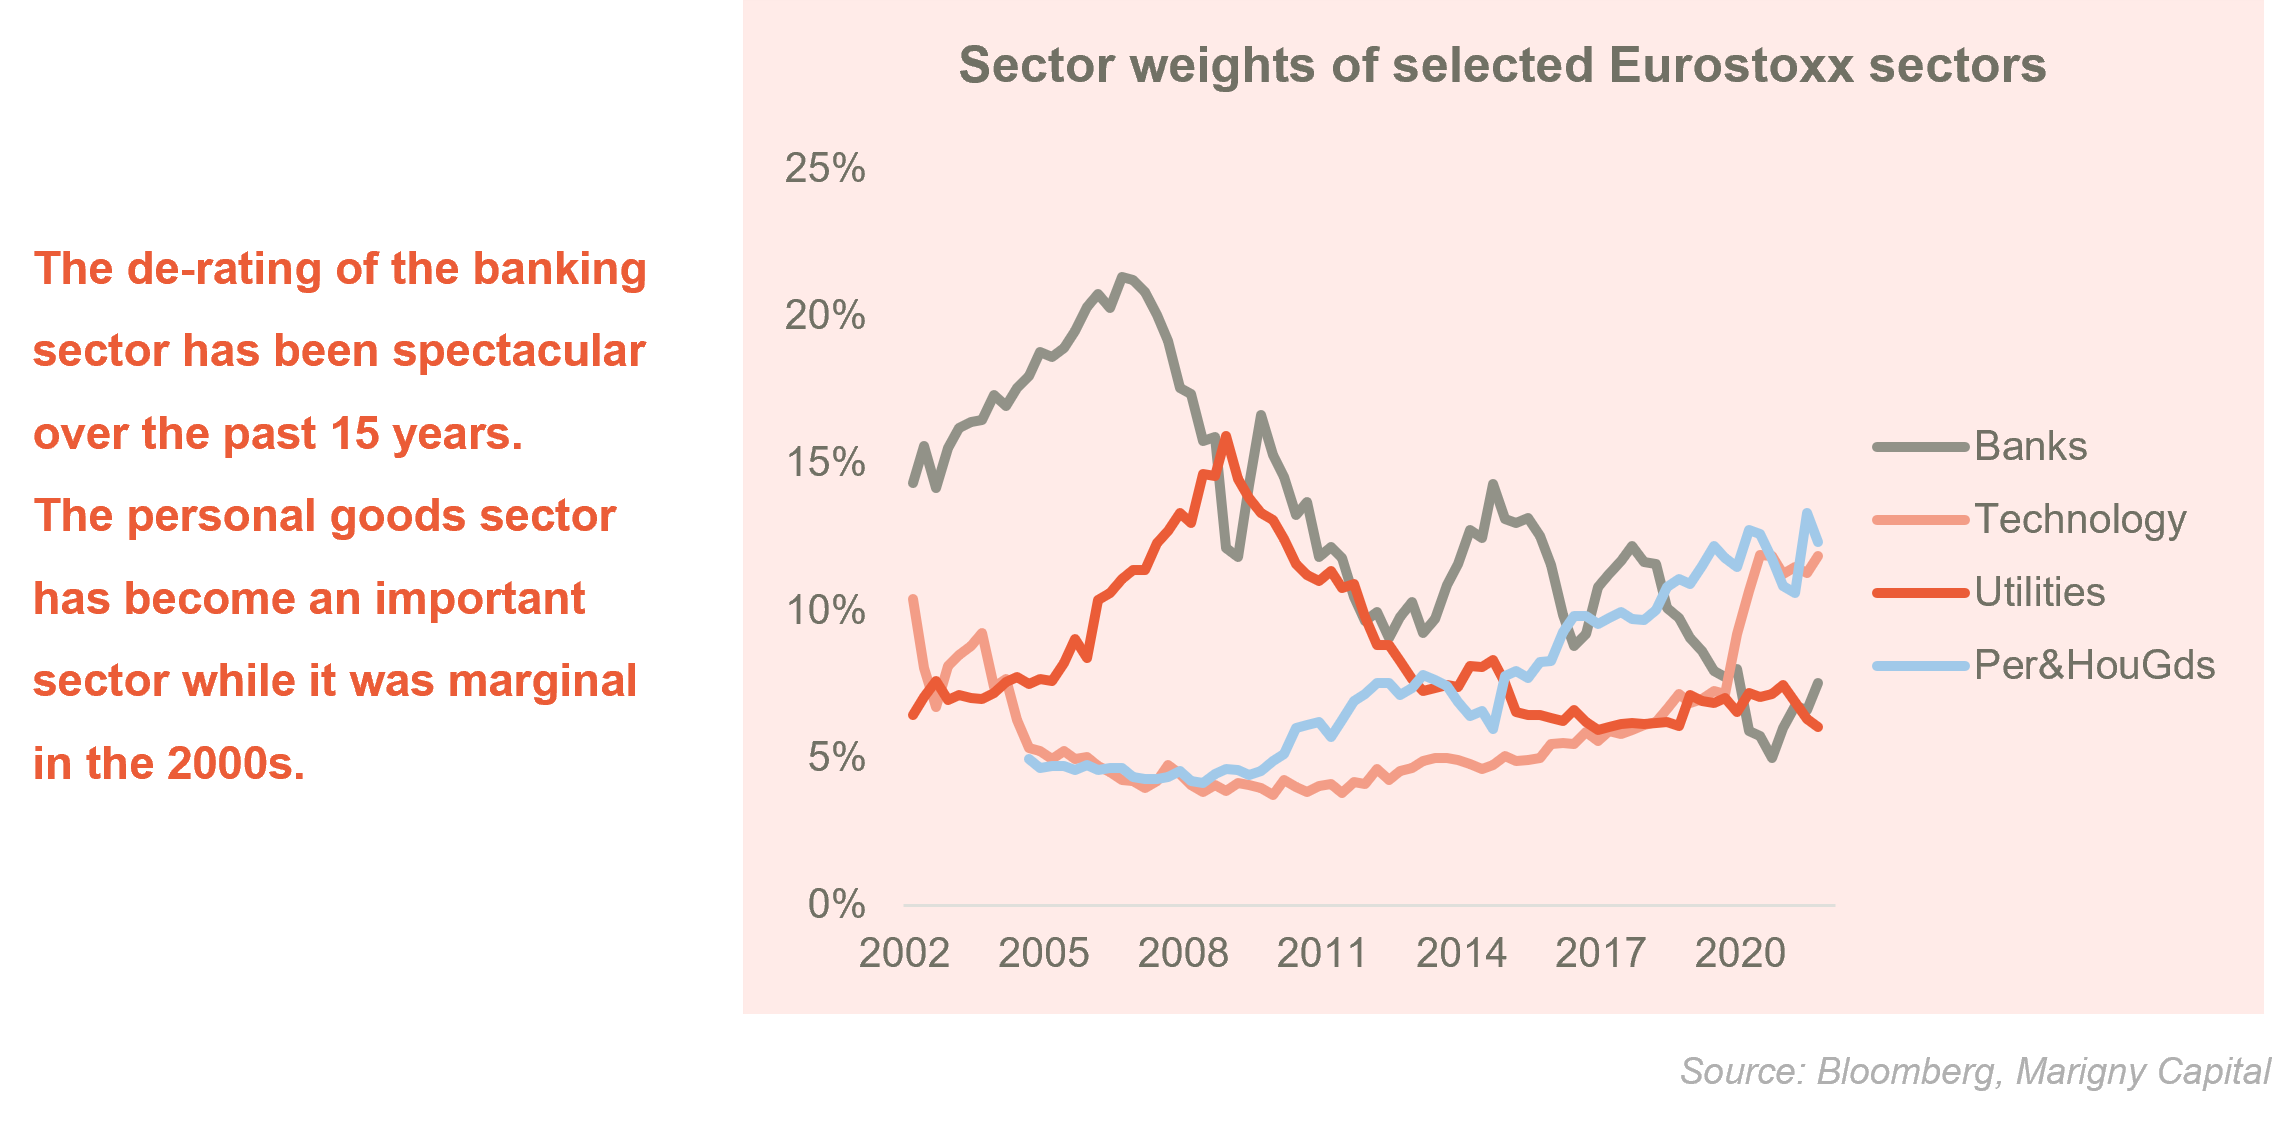
Financial services contribute to 4.5% of the value added in the euro zone while the sector still represents 12.5% of the Eurostoxx index (6.6% for the banking sector alone, black line above ). The technology sector has a weight of 11.3% in the index against an economic weight of 5.3%. Real estate only represents 2% of the index against an economic weight of 11.3%. Finally, the public sector represents 20% of the economy of the euro zone while it does not exist on the stock market.
The argument of the economic representativeness of the index is therefore weak and one could only conclude that the European equity index is inspired by what is happening in the real world but nothing more. Financial markets have another logic. They tend to extrapolate, to get excited. Politely, we will say that they live with the future. This is a nice definition of market efficiency and it would explain why the equity markets are ahead of the economy.
THE EUROSTOXX 50 IN 2021, AN INDEX OF BETTER QUALITY?
While the previous question is difficult to answer precisely, this one is easier: Have new entrants to the index improved the fundamentals of the index? The two graphs below answer this.
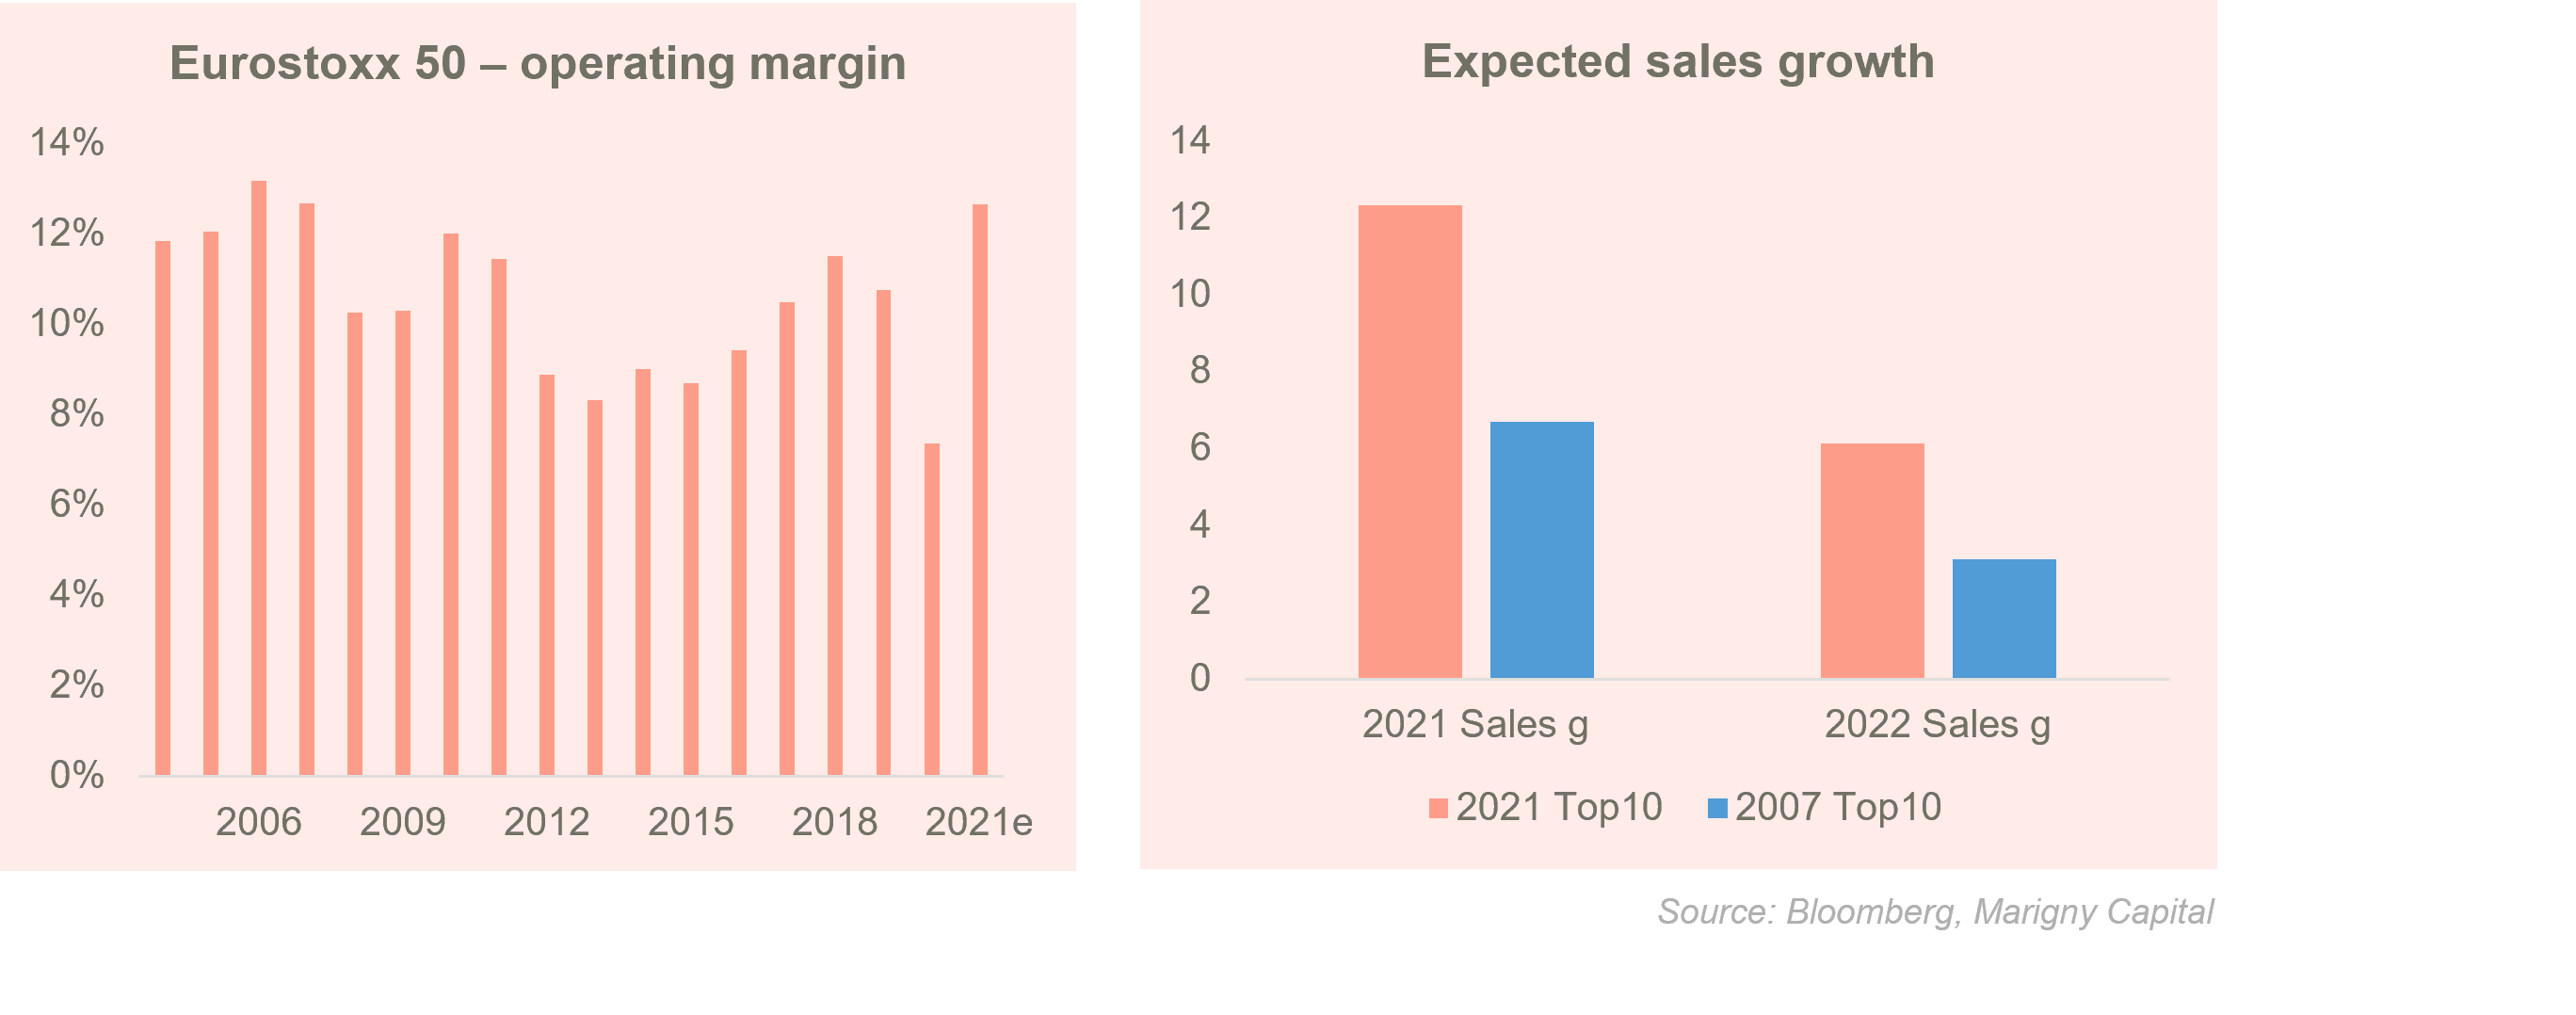
The index’s operating margin has not improved over time, on the contrary. Although it should return to its highest levels this year, there is nothing obvious from a profitability standpoint. The graph to the right, on the other hand, clearly shows that the growth profile has improved. If the top 10 stocks had stayed the same, revenue growth would have been + 6.7% for this year and + 3.1% next year. However, the 10 largest stocks currently expect growth of + 12.3% for this year and + 6.1% next year.
The re-balancing of indices is based on the valuation that investors give to stocks. Because investors are sensitive to the growth factor, re-balancing therefore allows the index to maintain a growth bias, or at least not to sink into value or deep value territory.
The fall in the weight of financials, telecoms and oil companies in favor of sectors such as technology, cosmetics and chemicals has genuinely rebalanced the Eurostoxx50. It is difficult to identify a significant thematic bias in its current composition.
THE EUROSTOXX 50 STILL HAS A VALUE/CYCLICAL STATUS
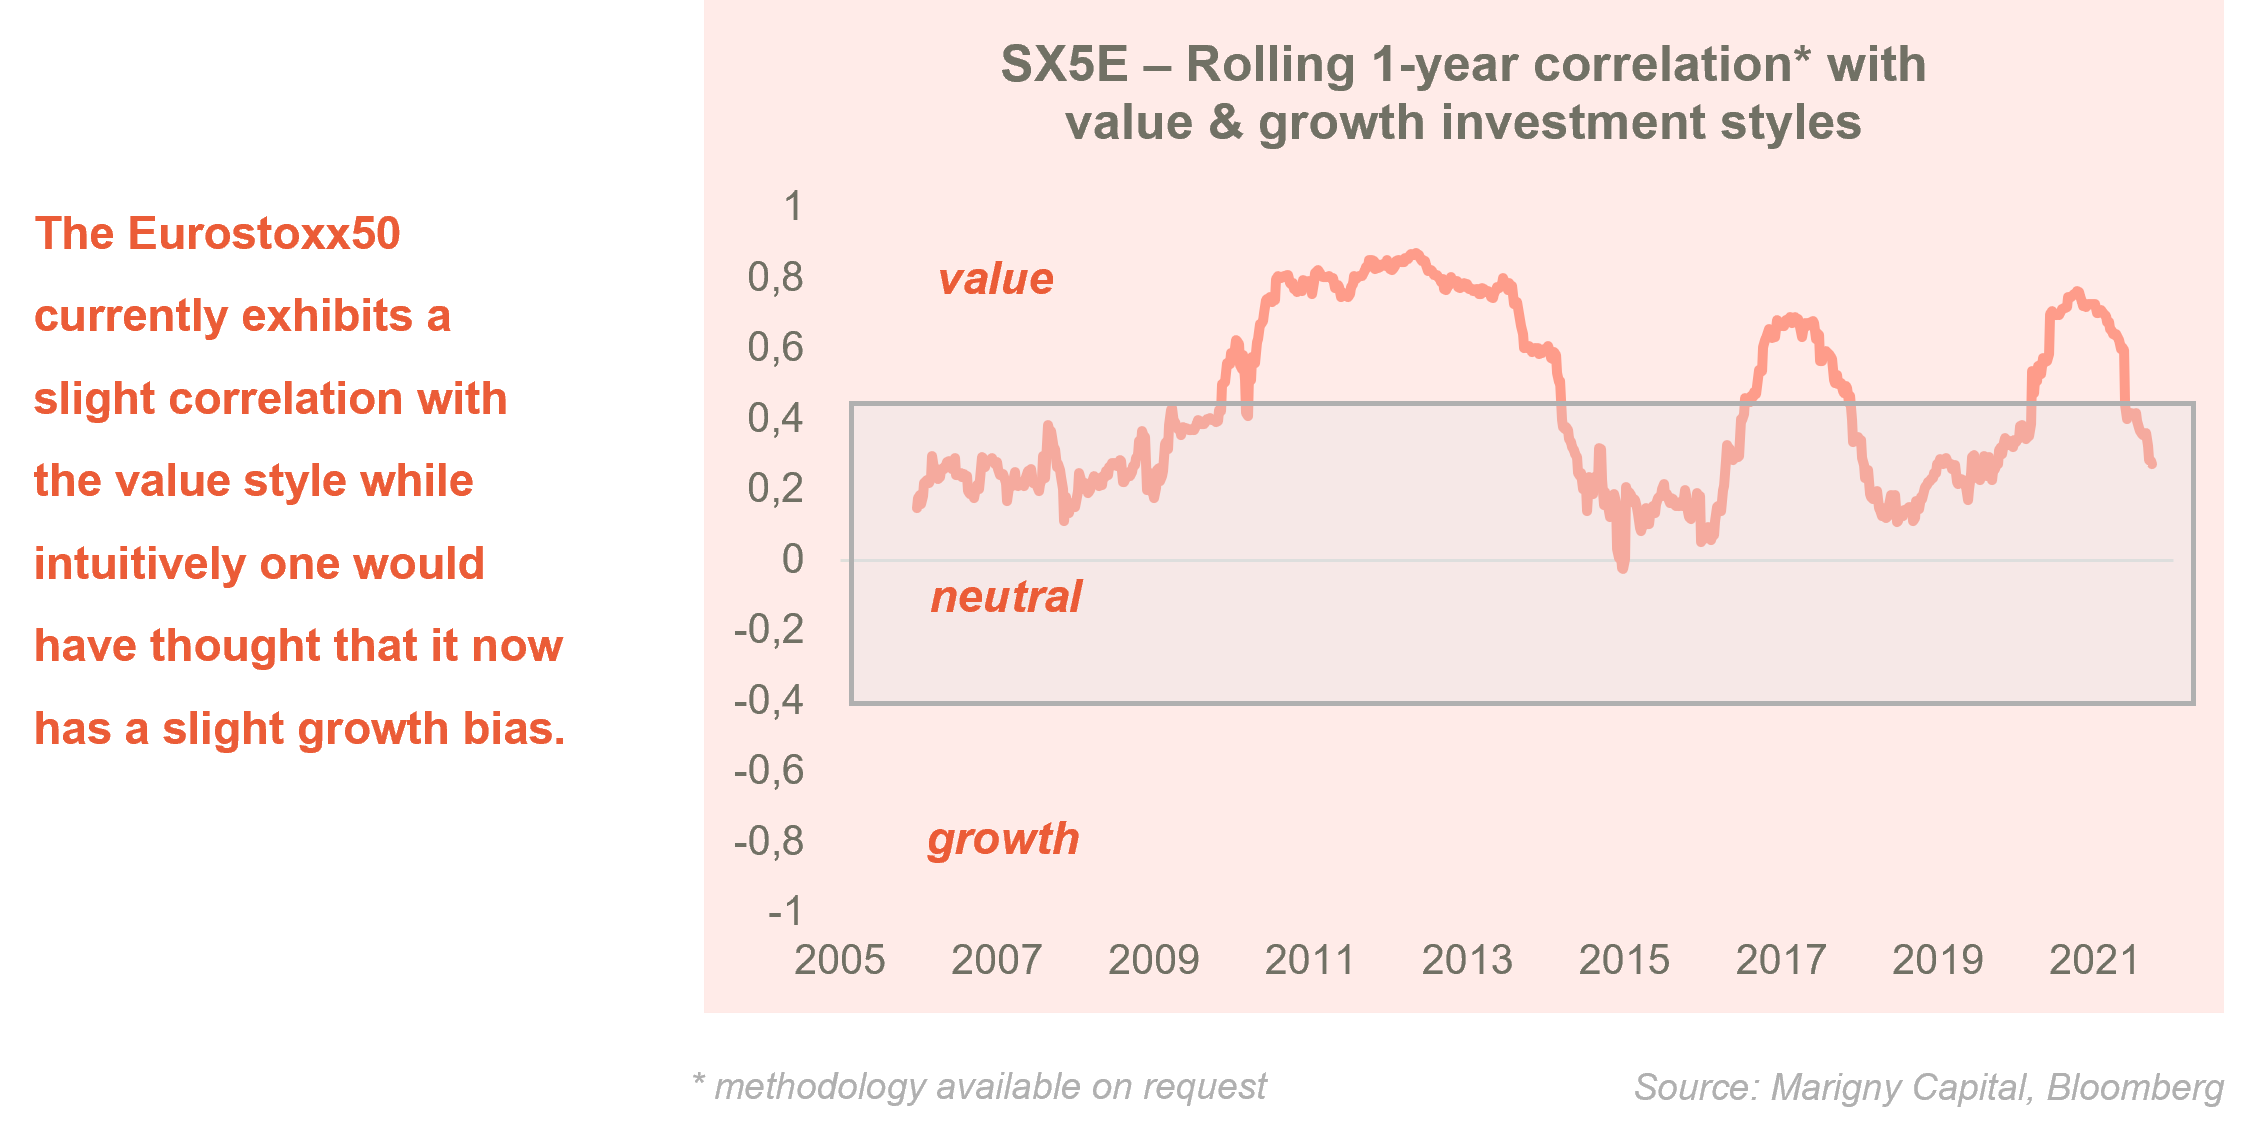
The three biggest stocks in the Eurostoxx50 today are ASML (semiconductors), LVMH (luxury-cosmetics) and SAP (software). Basically the index’s growth bias appears real. The graph on the previous page is therefore surprising since it suggests that investors have not taken notice of this change. The nature of the index’s risk, i.e. the risk perceived by investors, has changed little. The Eurostoxx50 is still viewed as a riskier, more cyclical index. It’s quite disappointing as this status does not seem to correspond to reality.
However, a change can be found in the derivatives market where the volatility traded on the Eurostoxx50 has indeed decreased. If implied volatility is a measure of risk, then in this case, investors have acknowledged the change in the nature of the risk of the Eurostoxx50. If we look at the 3-month at the money implied volatility of the Eurostoxx50, it was higher than that of the S& P500 by an average of 3.7 points between 2006 and 2017. But since 2017, the two volatilities have converged, and the spread has disappeared.
CONCLUSION
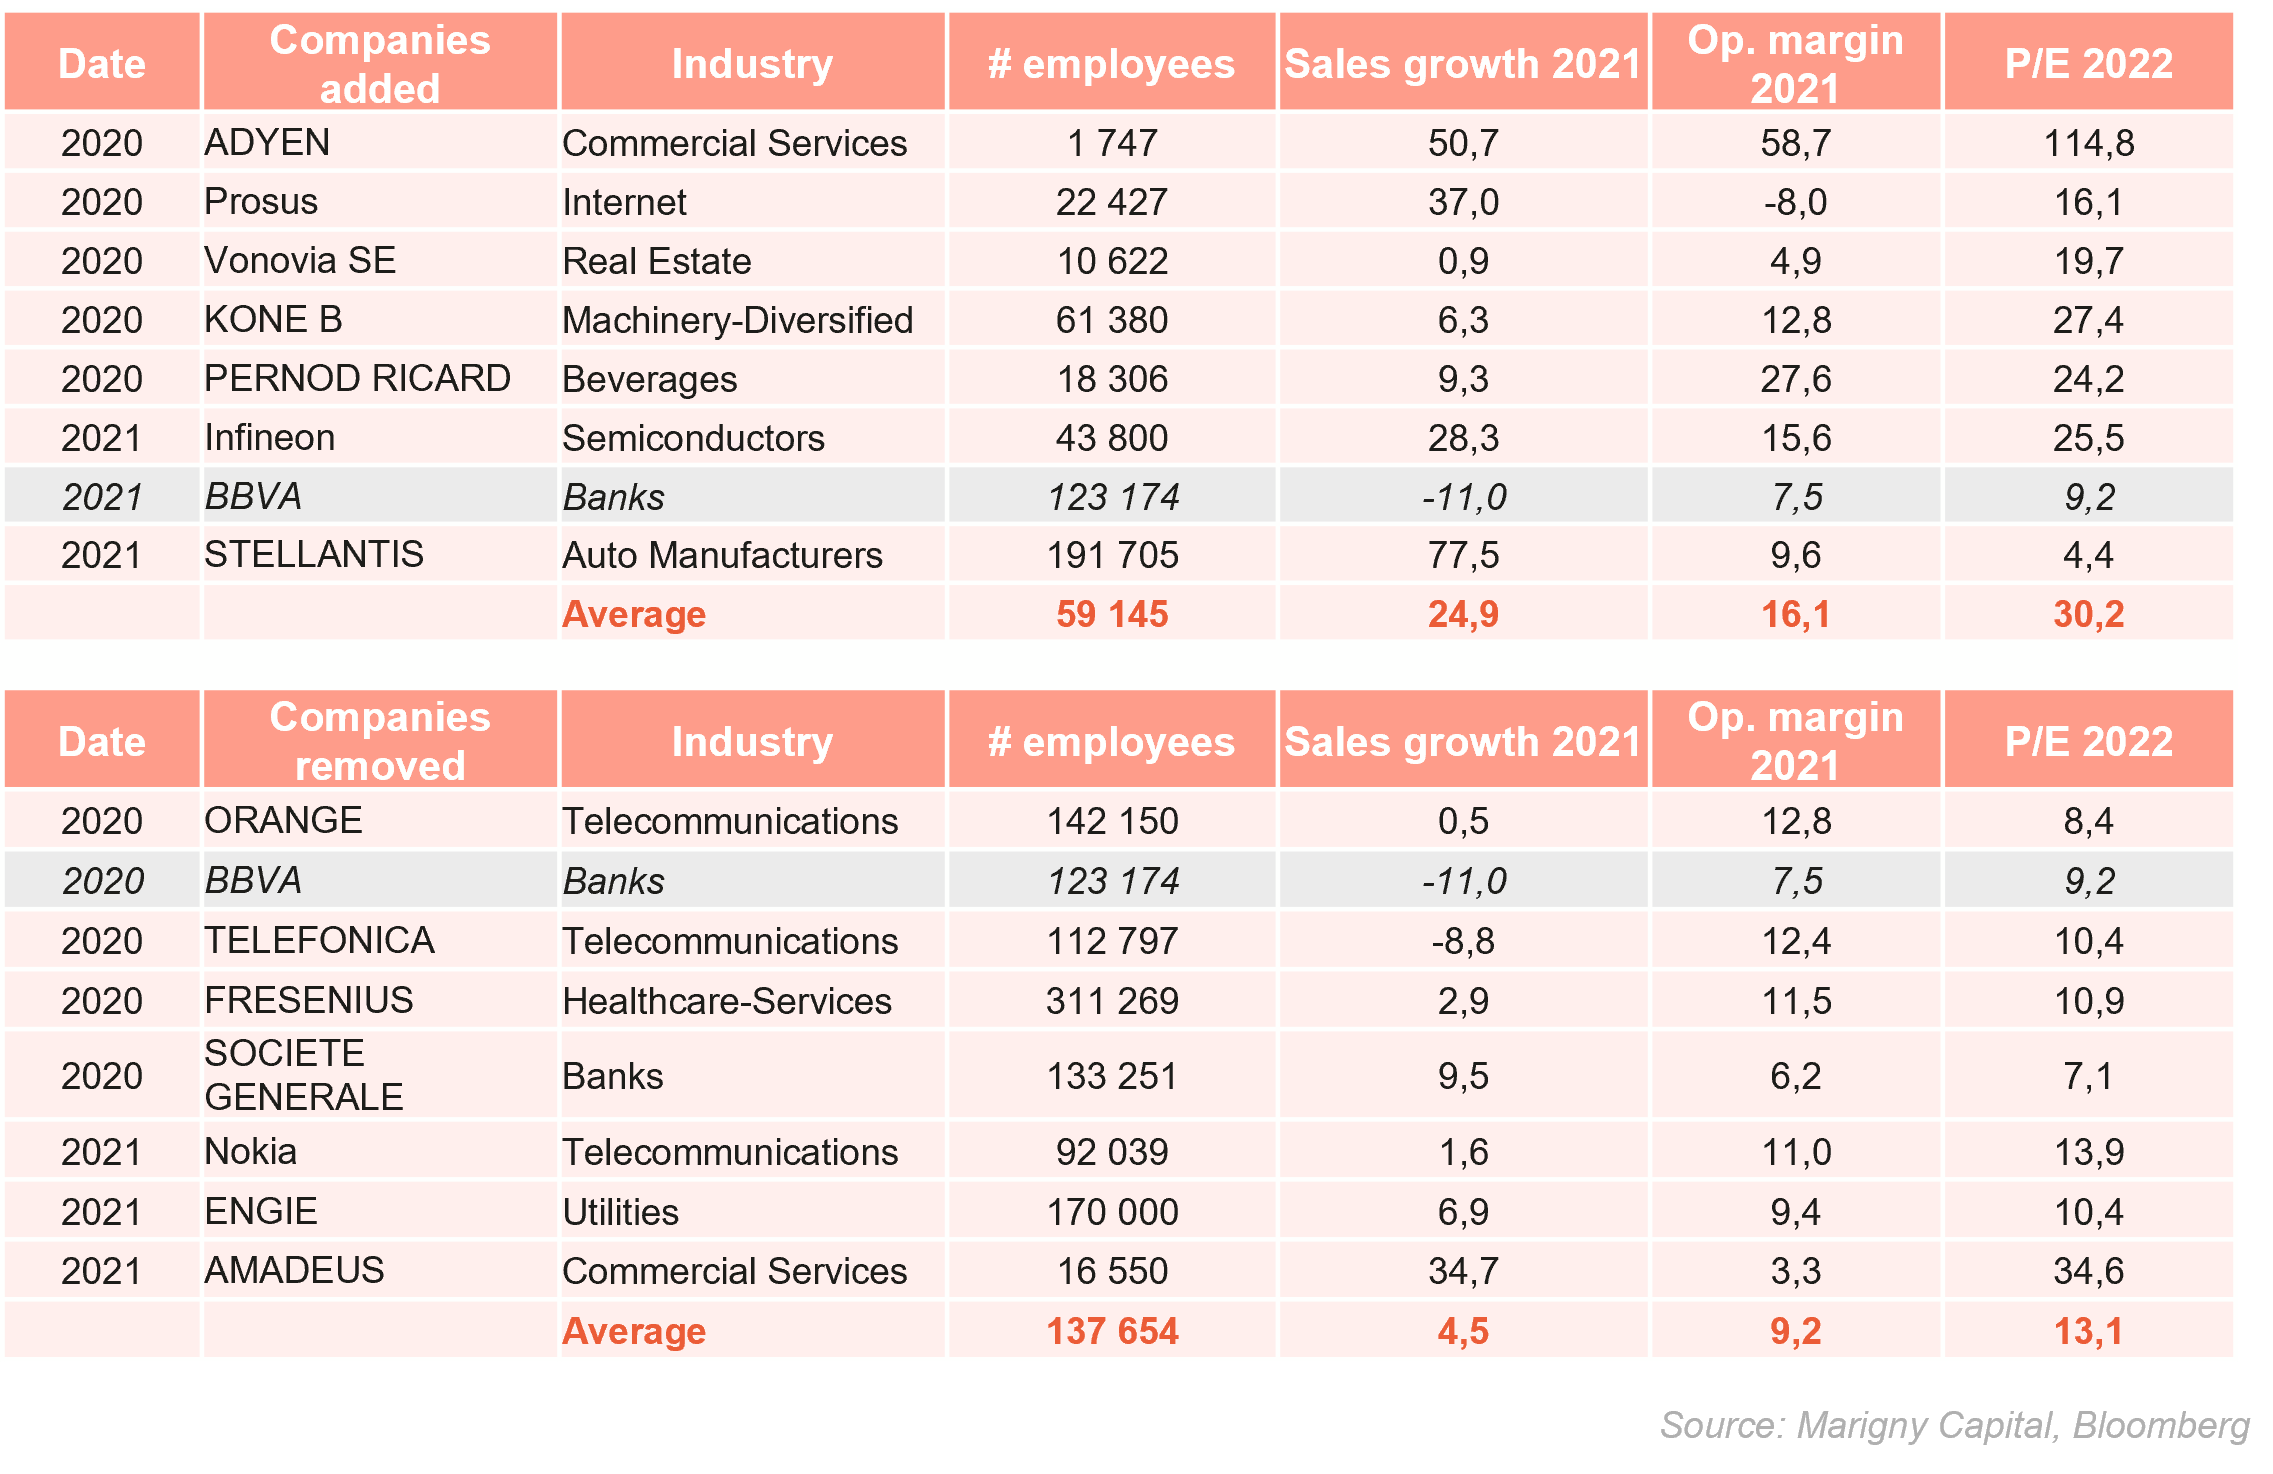
The Eurostoxx50 made its revolution, a Darwinian revolution: the strongest have outpaced the weak. Even if they are not the strongest from a profitability standpoint, they are the strongest for investors.
We can see this if we analyze the companies that have gone out and in over the past two years. We show them in the table below. BBVA is grayed out because the company made an out&in over the period.
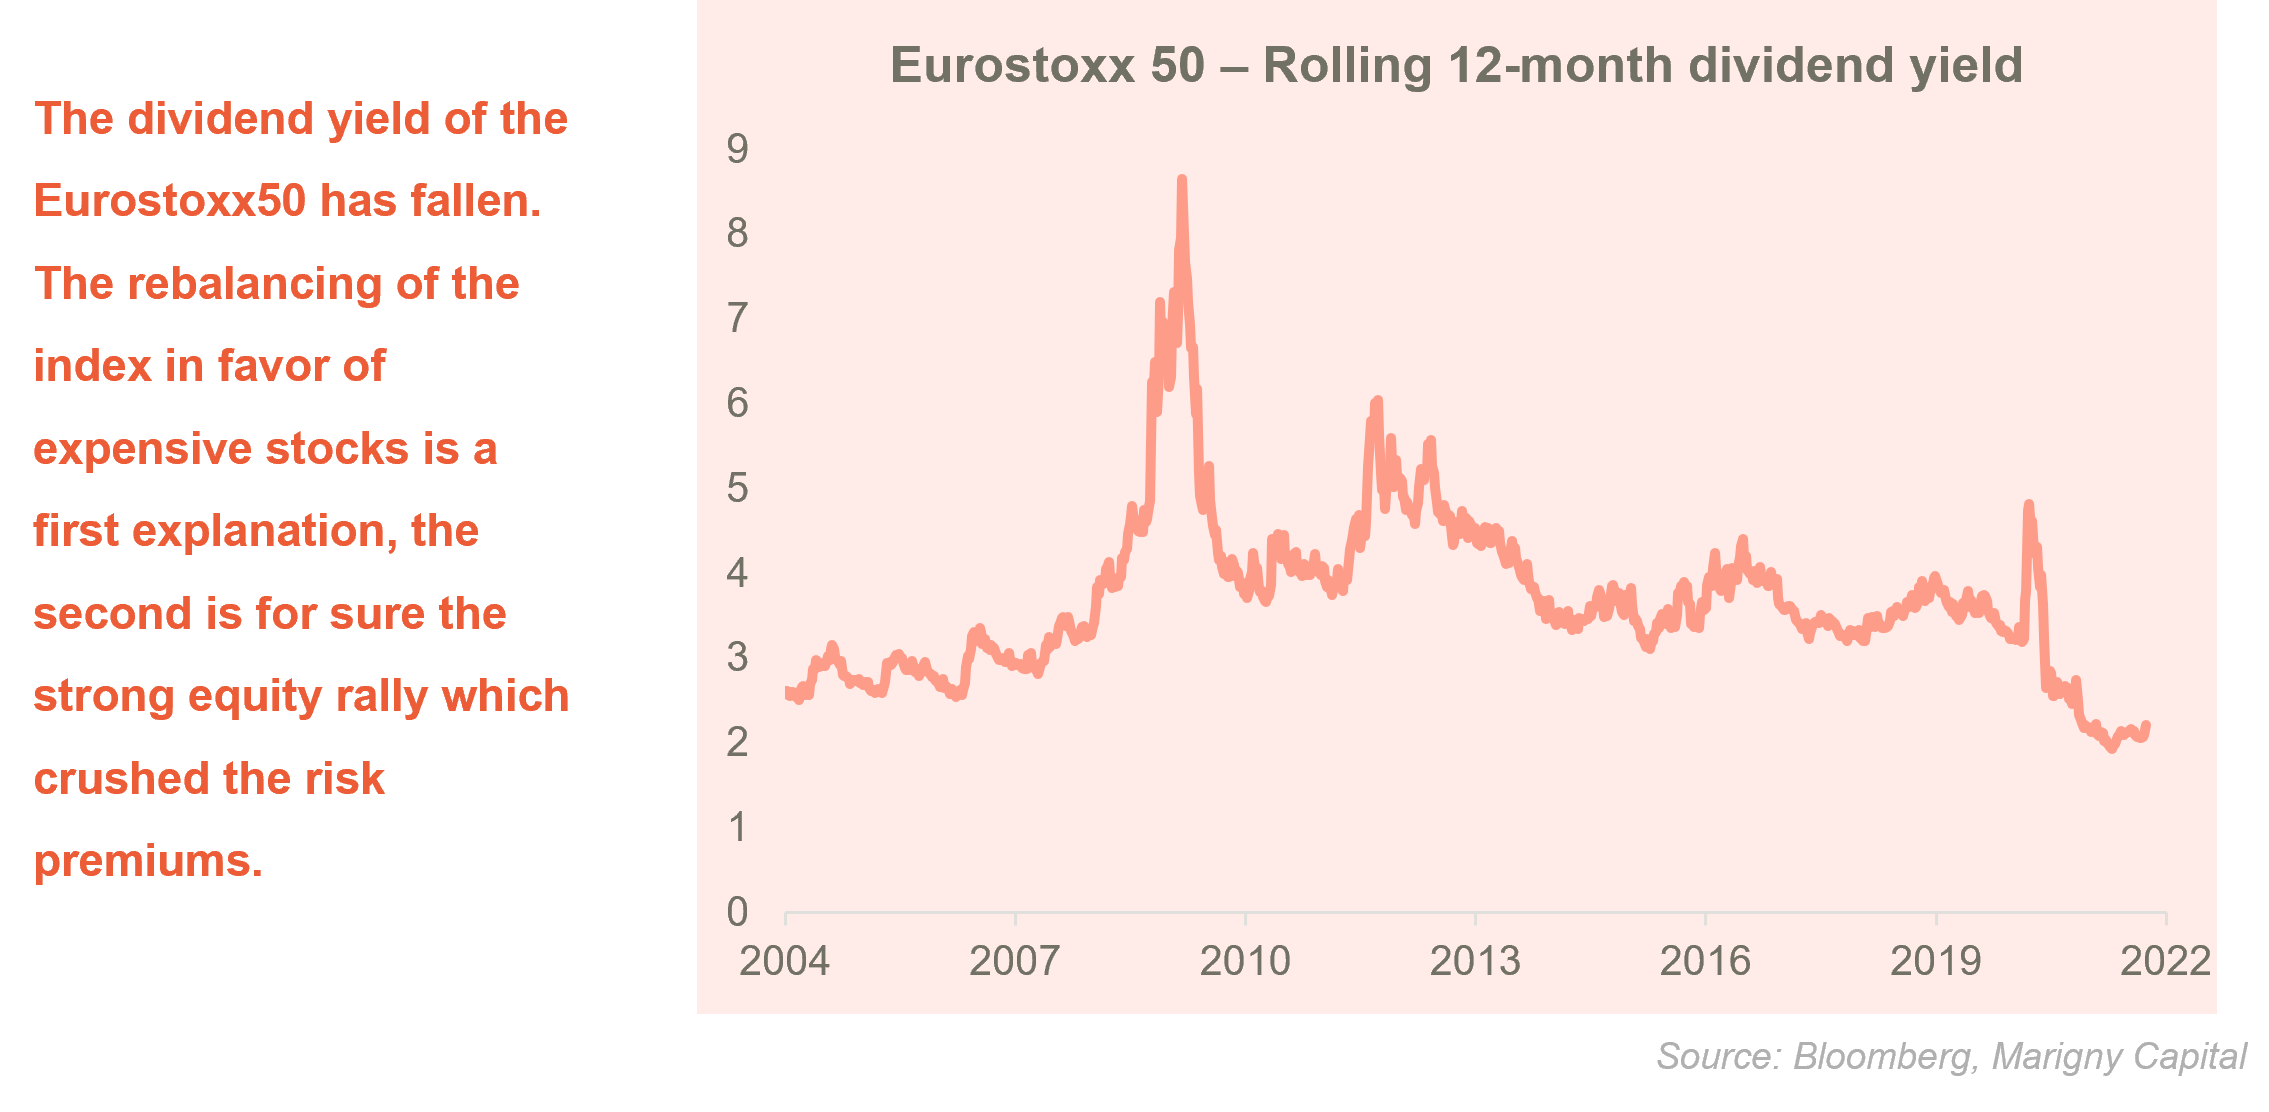
The graph above shows the dividend yield of the Eurostoxx50. It has been at its lowest for a long time. If we look at the dividend yield of the different sectors of the Eurostoxx, we can roughly estimate that the re-balancing of the index over the years now costs almost a percentage point of dividend.
The recent turmoil in the equity markets is nothing unusual for investors with minimal experience, and there is no reason to be upset. We will retain from this mini-phase of correction that the European index did not underperform, in particular compared to growth indices such as the S&P500 or the SMI. Compared to value indices like Korea and Japan, the Eurostoxx50 even significantly outperformed. The drop in the dividend yield can therefore be seen as the price to pay to have an index with better behavior, which would then be a good achievement for Europe!
admin
Categories
Last articles
Consumers’ payment habits in Europe
The ECB conducted a study on payment habits in Europe in 2019: Study on the Payment Attitudes of Consumers (SPACE); https://www.banque-france.fr/sites/default/files/media/2021/11/25/space_2020-12.pdf. Although the covid crisis has certainly changed these habits, the analysis remains relevant to compare the differences in practices within Europe..

Robinhood – a textbook case of financial analysis
Robinhood was created in 2013 in the San Francisco area, a few miles from Stanford University. It was at this prestigious university that Vlad Tenev and Baiju Bhatt met. Their ambition was strong: to democratize the financial markets by offering easy access to all apprentice traders. Their slogan was quickly found: “Investing for Everyone”. They […]